Sign up for ISO Alerts
Sign Up for ISO email and SMS alerts to recieve timely notices of ISO demand that could have an impact on your facility's ICAP tag and FY18 demand charge pricing if your facility is on a Time Of Use ("TOU") electric utility meter. Consult your electric utility bill and any commodity agreements you may have for details. AEI now provides coverage for 5 of the 7 major grid operators in the U.S. and will soon be adding ERCOT and SWPP.
Here's how it works
We'll take care of the linkage to connect to your real-time data feed.
Each morning we send you an e-mail message that shows the ISO forecast for today's peak demand and hour. Based on a review of the ISO historic margin of error in predicting the daily peak, we also include a rating to indicate the likelihood that the ISO will reach a new annual peak. The rating is on a scale of 1 (NOT LIKELY) to 5 (EXTREMELY LIKELY).
Every 15 minutes throughout the rest of the day, we watch the real-time demand on the grid. We will send you an SMS and/or email message when the current load exceeds 95% of the Reigning Annual Peak demand (RAP). In cases where ISO is rapidly approaching 95% of the RAP, we will send the alert earlier to account for the previous hour's rise. We will send additional alerts according to your frequency preference so long as the peaking conditions persist.
This is a FREE service. The only catch is that by providing your email address, you are opting in for our very occasional newsletters. We will only use your phone number in connection with this service, and we don't share your information with anyone else. You can cancel the service at anytime.
Current ISO Status and Forecasts
ISO NE
MW
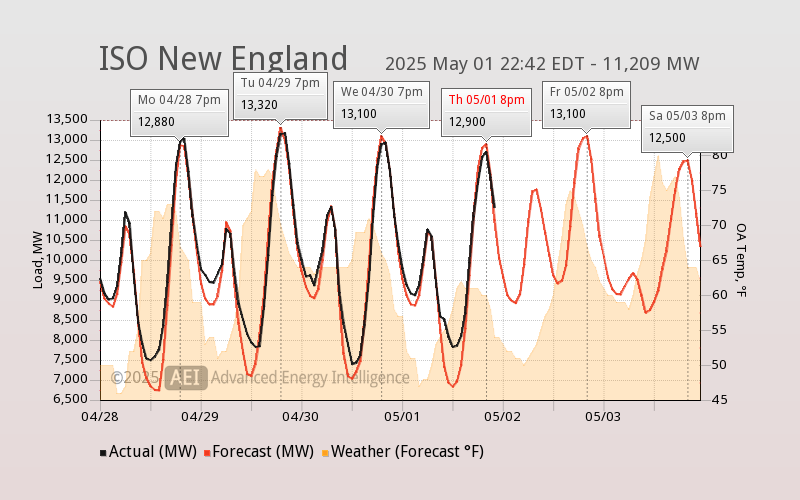
Click chart to view larger version.
NY ISO
MW
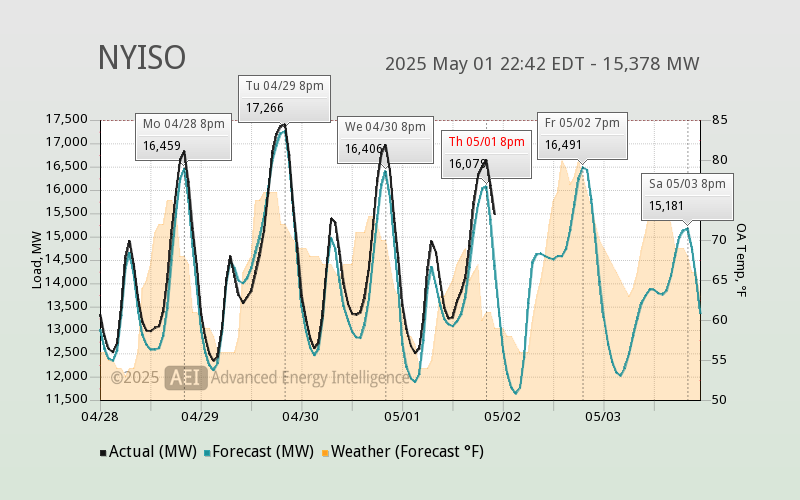
Click chart to view larger version.
MISO
MW
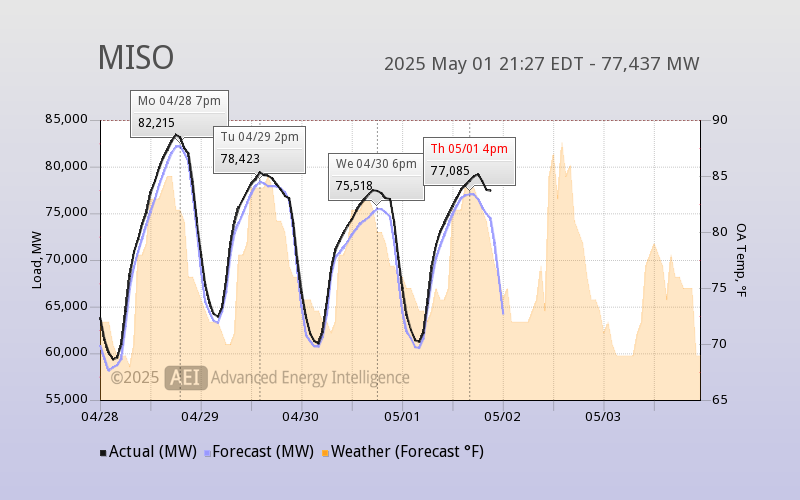
Click chart to view larger version.
PJM
MW
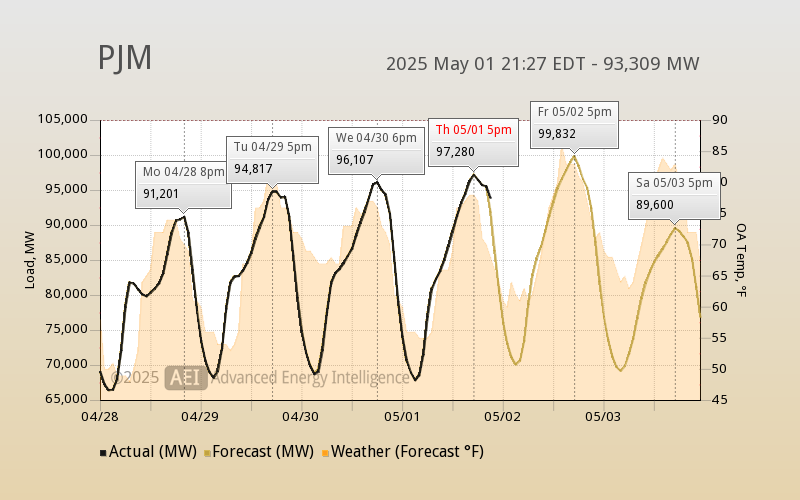
Click chart to view larger version.
ERCOT
MW
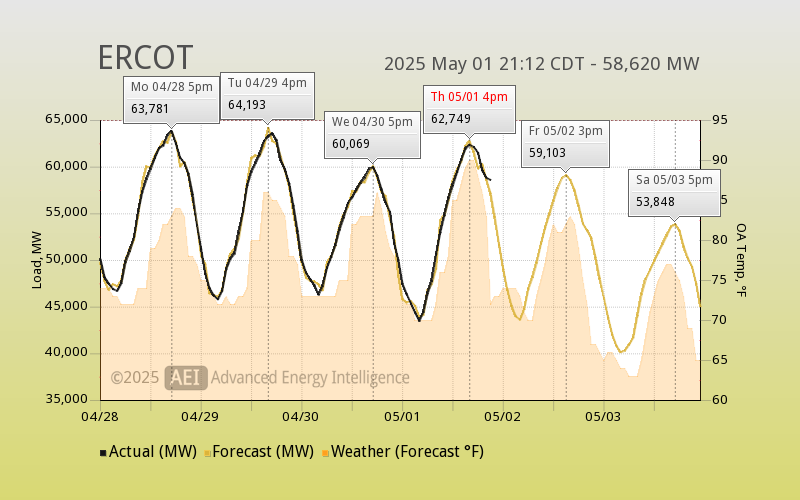
Click chart to view larger version.
CAISO
MW
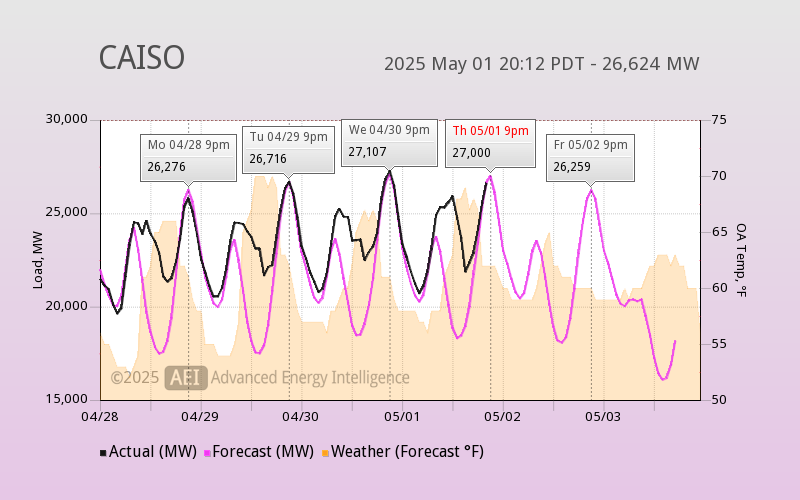
Click chart to view larger version.
SPP
MW
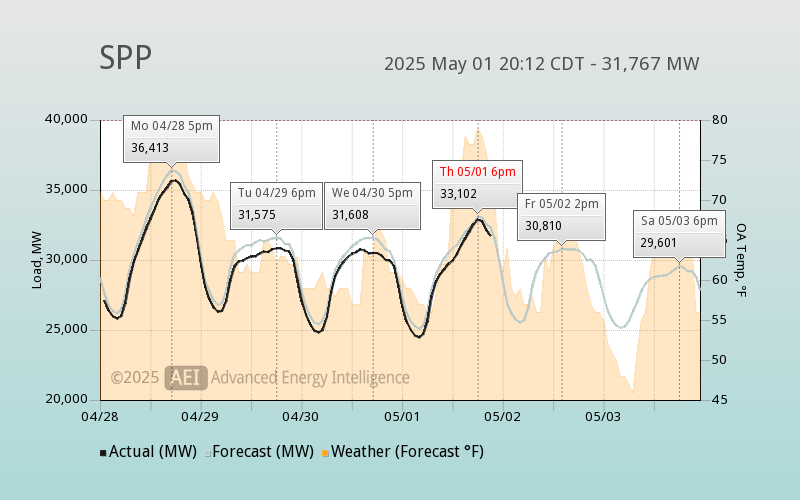
Click chart to view larger version.
National Grid UK
MW
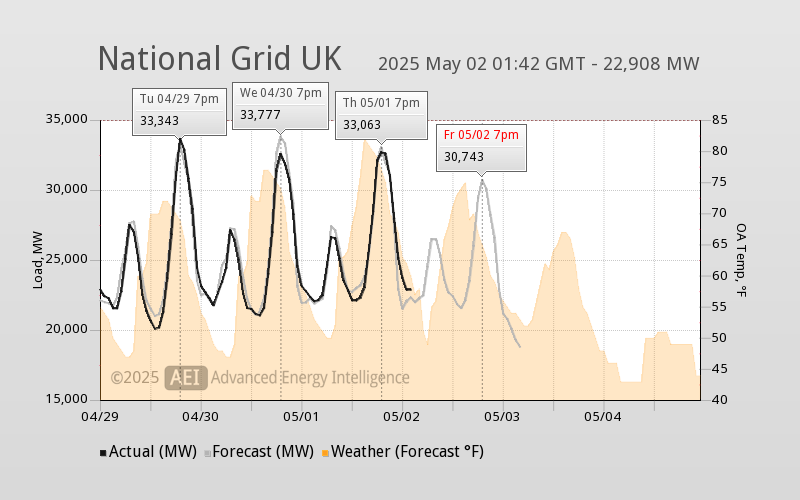
Click chart to view larger version.
IESO (Ontario)
MW
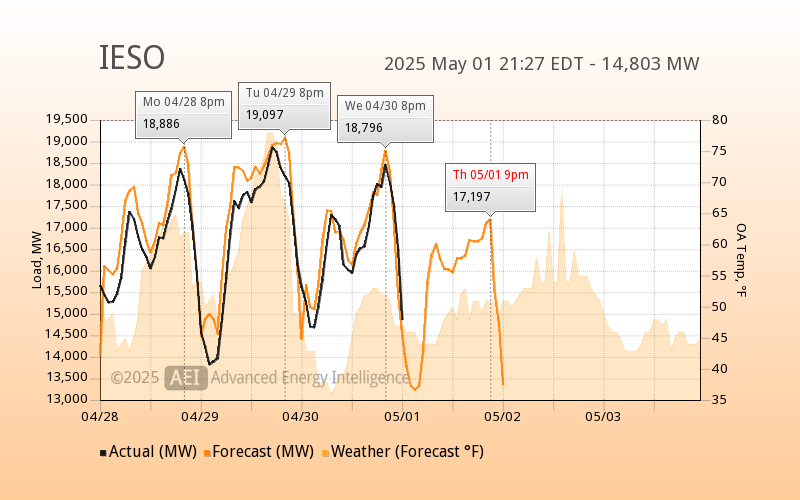
Click chart to view larger version.
For additional details about RTO operations:
- ISO New England - visit www.iso-ne.com/isoexpress
- NY ISO - http://www.nyiso.com/
- MISO - http://www.misoenergy.org
- PJM - http://www.pjm.com/
- CA-ISO - http://www.caiso.com/
- ERCOT - http://www.ercot.com/
- SPP - http://www.spp.org/
- National Grid UK - https://www.nationalgridet.com/
- IESO (Ontario) - https://www.ieso.ca/
Feel free to contact us for additional details.


.png)