AEI ISO Alerts
This FREE service will send you ISO Demand Alerts when the regional grid is approaching a peak demand condition.

2026 Service Notice: The AEI ISO Alerts service will resume on Monday, June 15th, 2026. Read the AEI ISO Alerts 2026 Service Notice for details. Signup now on the AEI ISO Alerts Sign-up page (v 5.6.40).
AT&T users - PLEASE NOTE: AT&T is discontinuing its email-to-text and text-to-email functionality on June 17, 2025. This means you will no longer be able to receive text messages from AEI starting on that date. Any SMS alerts we send are also sent to the e-mail address we have on file for you, so you may want to set your e-mail to do a push to your phone if receiving our alerts is important to you.
If your facility usage correlates with the typical weather and grid demand patterns, this helpful service can send you real-time alerts when your regional ISO is approaching a calendar-month peak or more importantly, an annual peak that may be used to determine your ICAP tag.
Benefit
There are several subscription services that will send out a morning report with a prediction about the grid conditions for the day, but with an AEI ISO Alert you get real-time notifications that are much more timely. The forecast may predict a peak at 5pm, but it could turn out that the peak for the day occurs at 2pm. We pay attention every 5 minutes, so when we see the grid is blowing through their forecast you'll see a text message at 1pm to let you know.
Do we predict the future? Not really. But we do know from the history that all RTOs miss their forecasts by at least a few percent on a regular basis - both in magnitude and time-of-day - especially during the daytime hours that matter most. So when we see the grid is running ahead of forecast on a day with a high probability of hitting a new annual peak, you'll know about in time to react.
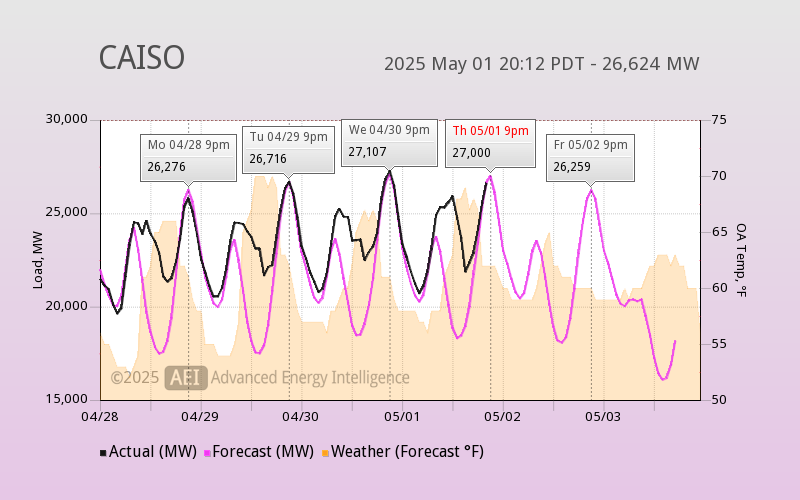
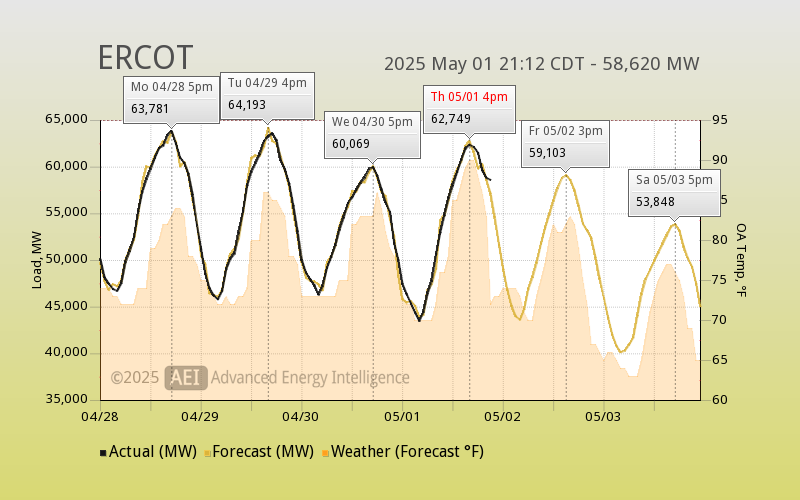
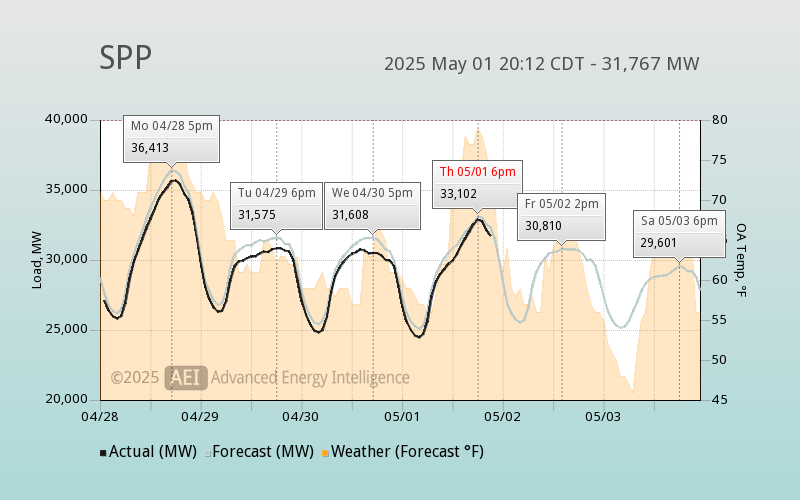
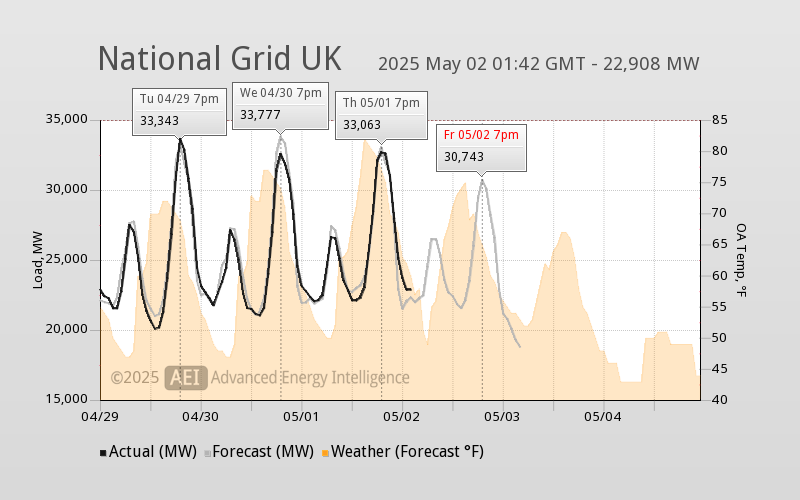
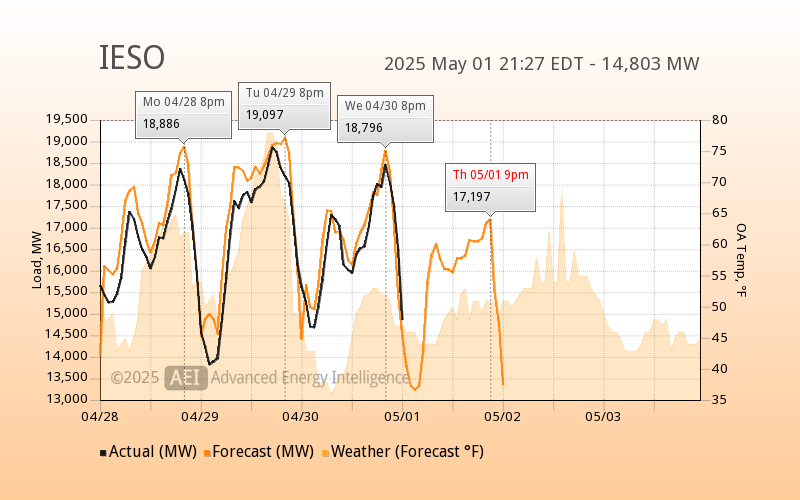
Current ISO Status and Forecast
Charts autorefresh every few minutes. Click any chart for a more detailed view. New! Click on any orange Year number below each chart to show a ranked list of Top 10 Hours in the selected year where available.(1)
| Year | Peak Load, MW | Date/Time & Weather (BOS) |
|---|
| Year | Peak Load, MW | Date/Time & Weather (NYC) |
|---|
| Year | Peak Load, MW | Date/Time & Weather (NOL) |
|---|
| Year | Peak Load, MW | Date/Time & Weather (PHI) |
|---|
| Year | Peak Load, MW | Date/Time & Weather (LAX) |
|---|
| Year | Peak Load, MW | Date/Time & Weather (AUS) |
|---|
| Year | Peak Load, MW | Date/Time & Weather (OKC) |
|---|
| Year | Peak Load, MW | Date/Time & Weather (London) |
|---|
| Year | Peak Load, MW | Date/Time & Weather (Toronto) |
|---|
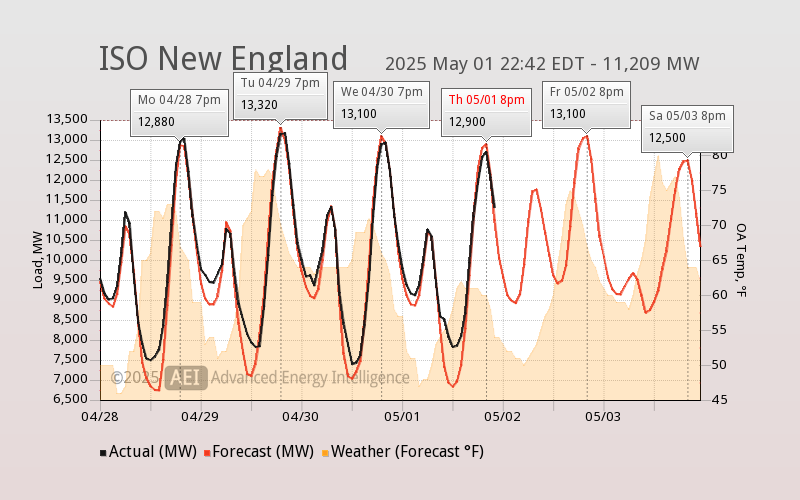
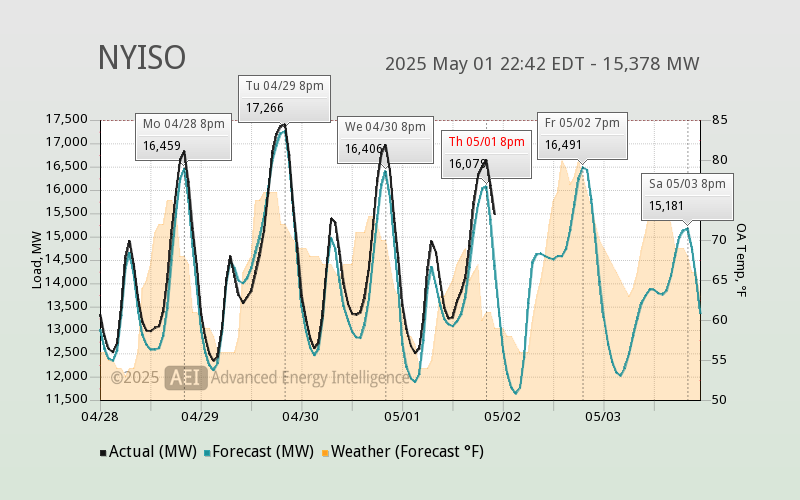
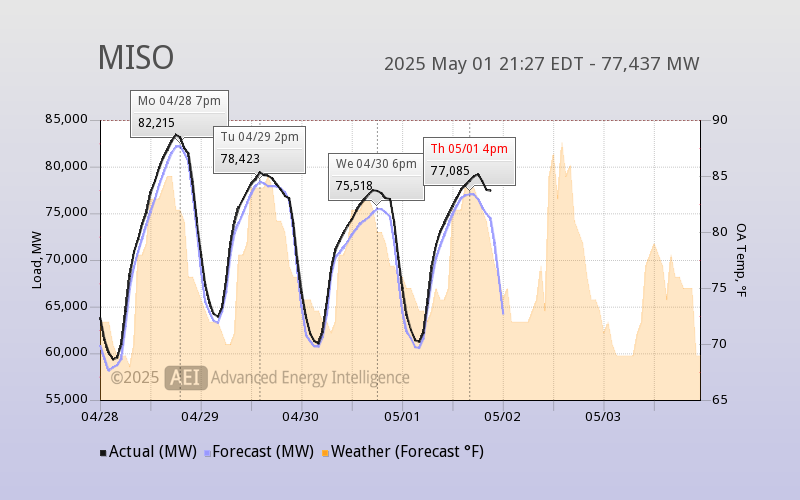
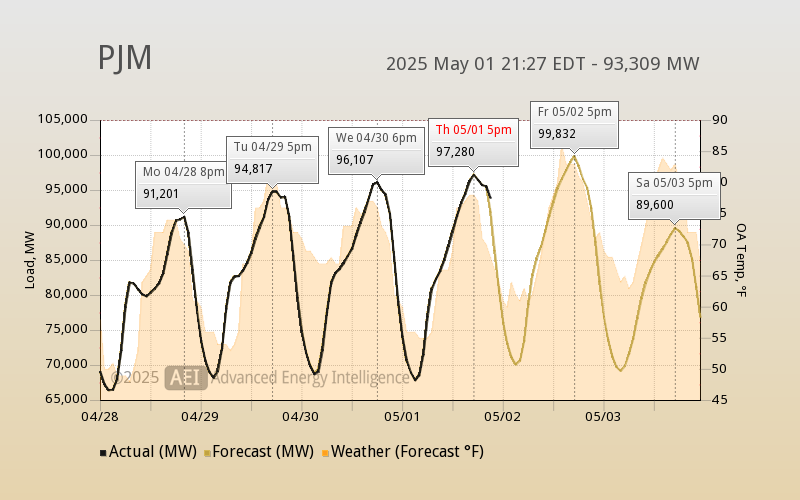
Current ISO New England, NY ISO, MISO, PJM, CA-ISO, ERCOT, SPP, NG UK and IESO actual real-time loads and forecast are part of the
morning report sent each weekday during the summer cooling season. The current actual loads are evaluated every 15 minutes
and an SMS or E-Mail alert is sent an hour or two before a new annual peak might occur.
Click on the charts above for a bigger picture.
(1)The Average hour calculations are made by us using the raw 5-minute, 15-minute or hourly data available from each ISO. The hour number shown in the table is the ending hour of the average, so for example if the table shows 18:00, this is the average value for all loads between 17:01 to 18:00 on the given day. Consult your relevant ISO for their exact peak calculations since algorithms may vary.
System-wide mid-day load shedding measures over the past years have had the effect of pushing the peak hour later into the day, sometimes as late as 5pm to 7pm when commuters return home from work and immediately crank up the AC. Commercial spaces feel confident they can avoid the predicted peak just by going into the standard end-of-day setback mode. But we've seen cases where the peak for the day comes earlier than predicted and voila, the commercial space is caught running at full tilt at the same time the grid is peaking. If it so happens that ISO calls the annual hour on that day, that facility is now stuck with a very high ICAP tag that will cost them dearly for the entirety of the next fiscal year.
ICAP Tags
A facility's installed capacity "ICAP" tag - the coincident demand of the facility at the time of the ISO peak annual hour (or collection of hours in some regions) - is multiplied against the capacity charge rates set by the ISO. In FY17/18 for ISO New England that rate was $15.00/kW-month, and for FY18/19 it was $9.55/kW-month. Depending on whether there are commodity contracts in place to blend or hide this charge, the facility subject to capacity charges would have paid $15.00 for each kW of their ICAP tag each and every month for all twelve months from June 2017 through May 2018. So while an ICAP tag is assigned to a facility based on a single hour in the year, it's the gift that keeps on giving - in the form of higher demand charges on every monthly bill in the subsequent year. And by gift, we mean your gift to your utility.
In some markets, notably ISO New England, demand charges have been dropping since the high point in 2017. In the most recent forward capacity auction, the clearing price of $2.00/kW-month for the 2023/2024 season set an all-time low price. Conversely, in the PJM territory, prices will nearly double in 2021/2022 due to the retirement of substantial amounts of nuclear and coal-fired capacity.
So since the kW rate you are paying for your ICAP tag was determined about a year ago, there are really only two things you can do this summer to keep your demand charges as low as possible:
- Minimize your facility load at the same time the grid is peaking. This is preventative medicine for next year's bills because we won't know your ICAP tag until this season is complete. It's an honorable objective, but it won't help you this summer.
- Minimize your facility load whever it is approaching a new peak in your billing cycle. If you're current billing period peak is already at 200 kW, then avoiding a new peak of only 10 kW higher is effectively saving 5% on the demand charges for the current month.
One approach to these aligned objectives is to shutdown entire parts or systems in your building on hot days - effective, but at the expense of building comfort. Instead, our alerts are designed to give you a more refined approach. The morning report is an assessment of the day's risk that the grid might be setting it's annual hour today, and the alerts that come within hours of a potential peak are intended to give you reaction time to engage your particular demand response protocols without placing unnecessary burdens on comfort or production.
As to the billing period peaks at your facility, we can help you with that if we are watching your building with real-time remote monitoring. If it's a hot summer day and you're already at 90% of your billing period peak kW by 10:00 am, you might want to know when you pass 95% later that day so that you can avoid a new peak for the billing cycle. Even though you might be safe from a coincident peak with the grid on any given day, you might as well try to avoid setting your own new peaks for immediate savings in the billing cycle.
A quick word about false positives and over-reacting to the morning report. Some nervous facilities see a high likelihood of an annual peak hour and will simply engage an all-or-nothing DR protocol as soon as they walk into the building that morning. In most cases it will turn out that the annual peak is not set. With the DR in place, usage is lower - and that's good - but the aggressive response to a peak prediction that doesn't occur may have come at the expense of building comfort, resulting in occupants who feel like you've cried wolf. During the summer of 2016, ISO New England exceeded 23,000 MW approximately 5% of the time and only set a new annual peak on 5 occasions. Rather than warn of a possible high peak on half of the 62 days in July and August, users of the AEI ISO Alert service were notified on far fewer days and with 2 to 4 hour notice of those new peaks.
How it Works
- Sign-up for free at AEI ISO Alerts on our website. All we need is your name, mobile phone and e-mail address. We use that information in connection with this service, and to send you an occasional monthly or quarterly newsletter. We do not provide your information to any third-parties.
- Currently, the service supports the ISO New England, NY ISO, MISO, PJM, ERCOT, SPP, CA-ISO, National Grid UK, and IESO.
- From mid-June through the end of September, we send out a "Morning Report" which relays the ISO forecast for the current day and up to the next 3 days to help you set up your daily demand response plan. After the Morning Report, you will receive an SMS and/or E-Mail alert when ISO demand is approaching a new peak.
- Users can customize the notification settings, such as the threshold and frequency for messages.
- Integrates with AEI Soft Start Real-Time so that your alerts can incorporate real-time loads from your buildings in addition to the regional situation. Whether or not the grid is peaking, it can be helpful to know if your building is likely to hit a new billing period peak. If your rate schedule has a demand charge component, this intelligence could help you save 1% to 10% of your monthly electric bill every month of the year.
- Integrates with AEI Energy Map for customers with 10 or more buildings in their portfolio.
Given that "peak season" is typically associated with the summer cooling months of June through September, the service is somewhat dormant during most of the year but is very active in the cooling season. This means you might not hear anything for a long while, and then find that SMS messages become more frequent in July and August once the trends have become established and new annual or monthly peaks are more likely.


.png)